Retail: When Every Store Is Its Own Puzzle

A grocery chain in Ecuador runs 3 stores from Quito to Cuenca. Each store faces a different challenge:
Quito (store47)
High-traffic urban location, volatile demand
Guayaquil (store24)
Major city, predictable spikes
Cuenca (store37)
Regional store, steady but sensitive to local events
Corporate wants a system for forecasting sales. But one-size-fits-all rules fit nobody well. Global averages miss local patterns. Per-store models require a data science team and weeks to build per location.
The Problem: The Inventory Paradox
Inaccurate sales forecasts leads to stockouts or overstocks: Stockouts lose customers; overstocks create spoilage. Fresh and perishable categories make the margin razor-thin.
The question: Can the Symnasium agent which has access to the latest time-series foundation models forecast store-level demand accurately—and automatically determine the best model per location?
Our Solution: The Symnasium Approach: 3 Stores, 1 Model, Seconds to Deploy
We gave our Symnasium weekly store sales for Corporación Favorita (Ecuador grocery chain), 2013-2017 data. The model had access to covariate data on foot traffic.
What we compared it to
Opus 4.8 Ultra Code tasked with building a forecasting model.
The test
13-week held-out backtest.
So, which stores does the Symnasium agent win vs. Opus 4.8 Ultra Code?
Our Findings
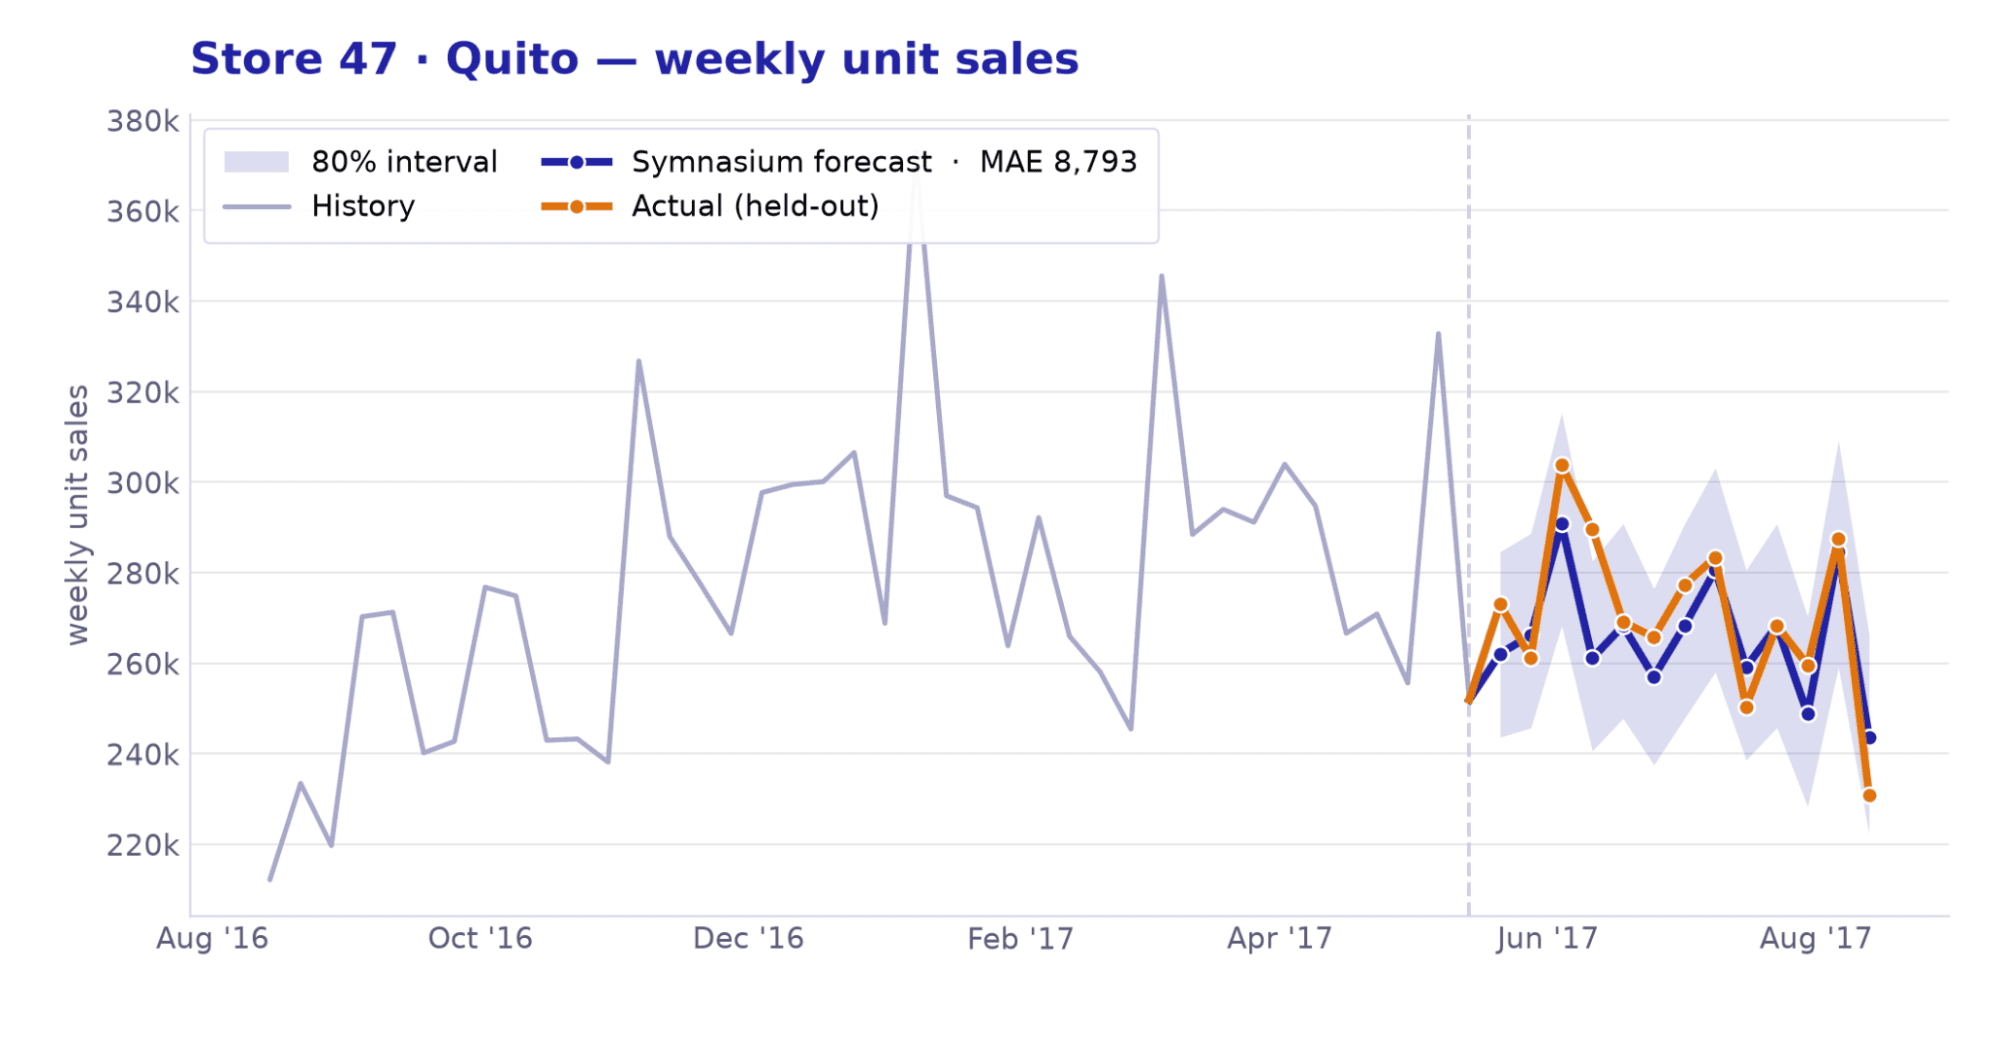
Store47 (Quito)
The Transactions Insight
MAE 8,793
Symnasium Agent
MAE 10,278
Opus
−14%
error reduction
But here’s the key finding: the transactions covariate cut Symnasium Agent error by 38-44% vs its own baseline.
What this means: Foot traffic data is worth the cost. In high-traffic urban stores, checkout activity is a leading indicator. The model quantified exactly how much value that feed provides—so you can decide if it's worth paying for.
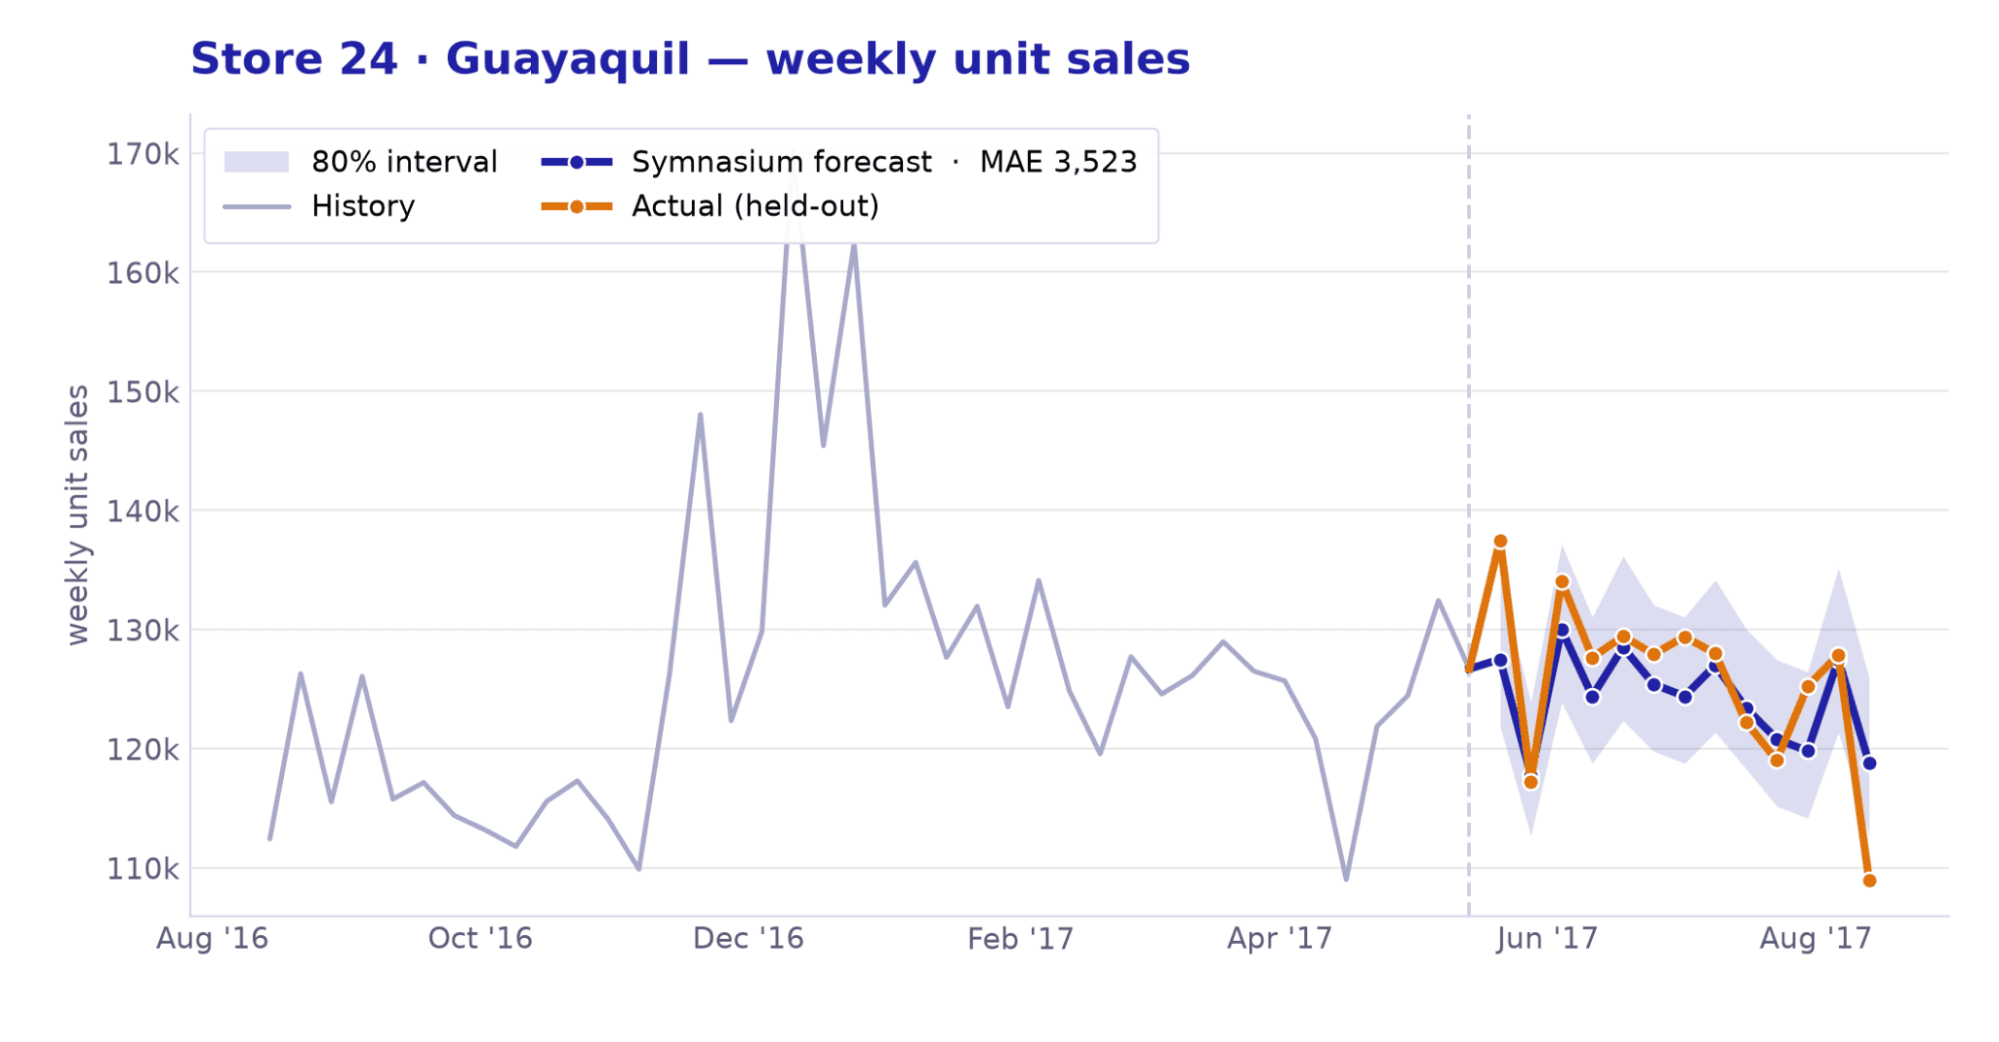
Store24 (Guayaquil)
High-Traffic Consistency
MAE 3,523
Symnasium Agent
MAE 4,165
Classical
−15%
error reduction
Major city, predictable patterns—the Symnasium agent captured the signal better than hand-tuned approaches.
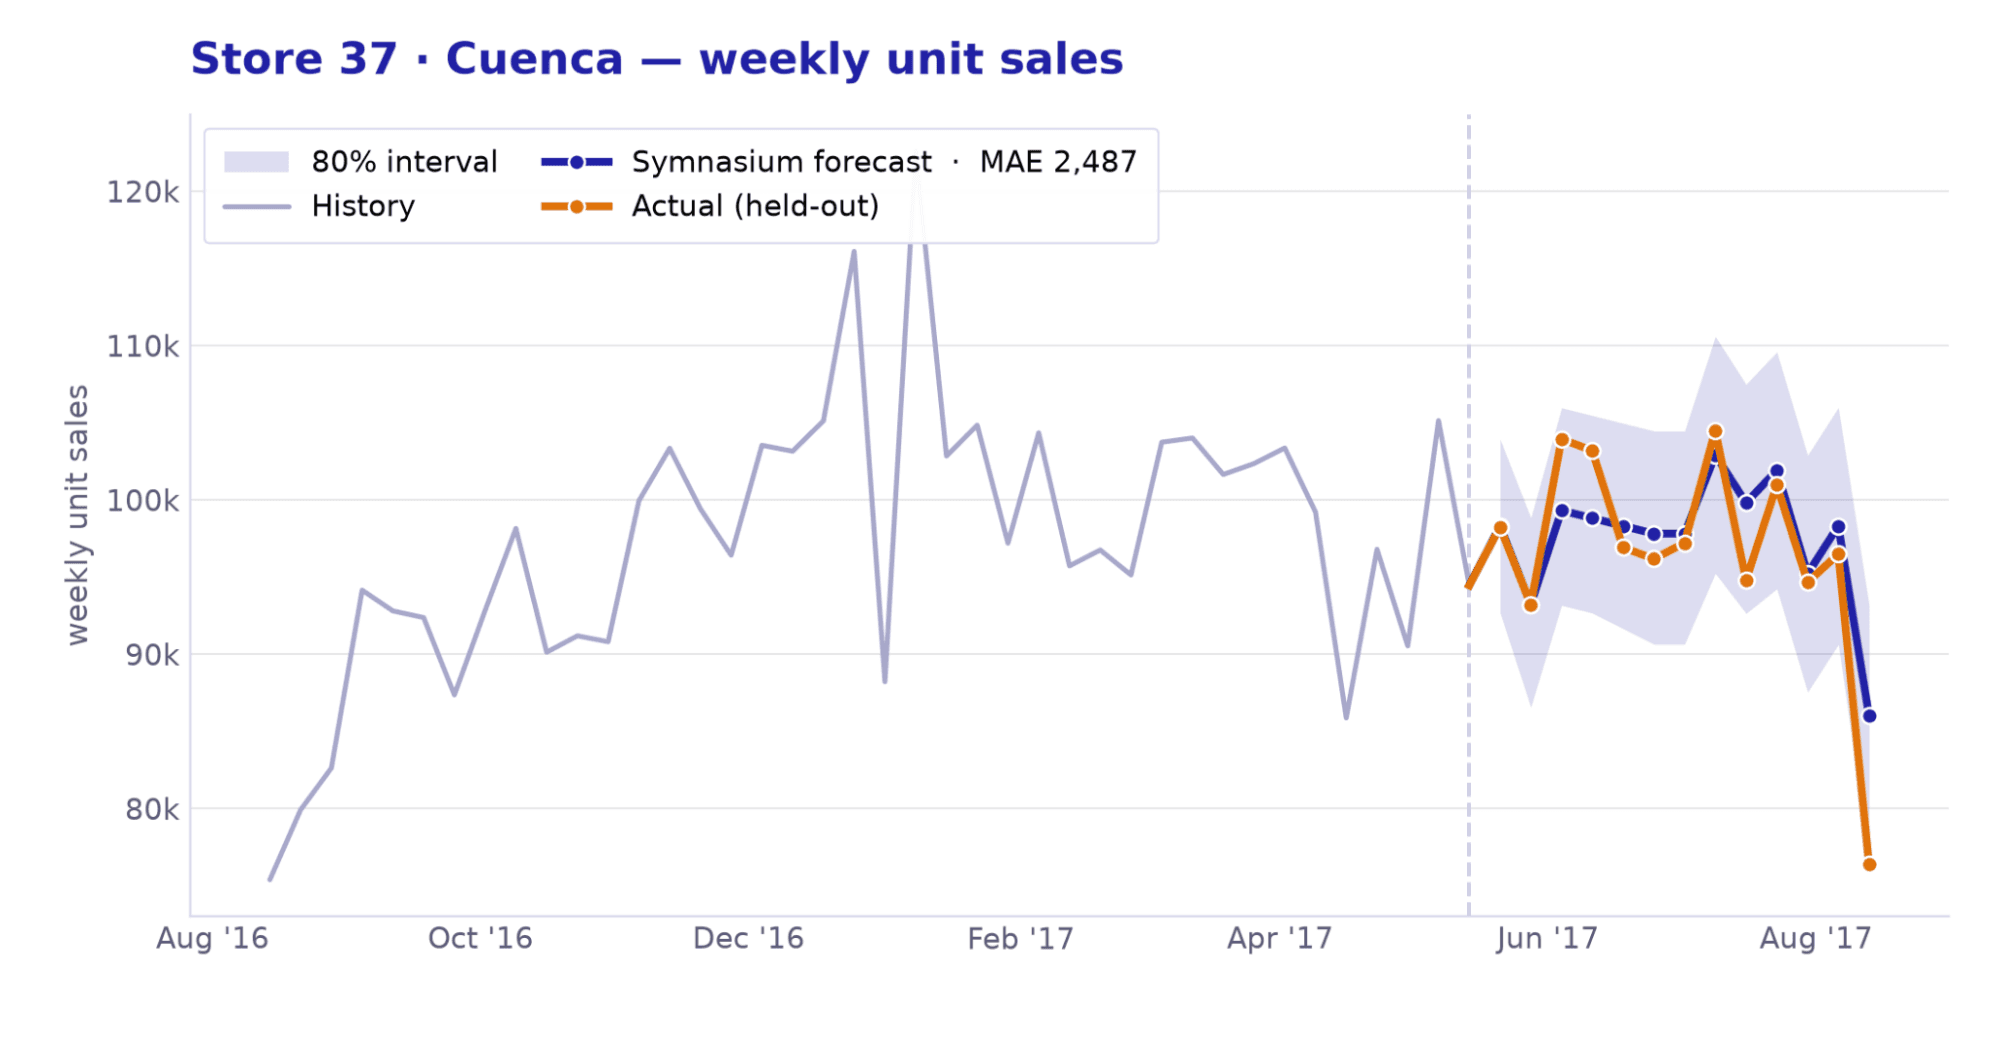
Store37 (Cuenca)
The Regional Winner
MAE 2,487
Symnasium Agent
MAE 3,272
Classical
−24%
error reduction — the strongest win
Regional stores have cleaner signals than chaotic urban locations. The Symnasium agent delivered the tightest forecast in the study.
The Tagline: Symnasium Agent Wins on all 3 stores
| Store | Location | Symnasium Agent MAE | Opus MAE | Improvement |
|---|---|---|---|---|
| Store47 | Quito | 8,793 | 10,278 | −14% |
| Store24 | Guayaquil | 3,523 | 4,165 | −15% |
| Store37 | Cuenca | 2,487 | 3,272 | −24% |
Platform auto-selected winners: Classical methods won 4 stores, Symnasium Agent won 3. The Symnasium agent automatically picked and evaluated the best time-series foundation model per location. Consistently outperforming Opus 4.8 Ultra Code.
Summary
| Metric | Result |
|---|---|
| Stores Tested | 3 (Ecuador grocery chain) |
| Symnasium Agent Chronos-2 Wins | 3 stores (−14% to −24% error reduction) |
| Platform Value | Build the best forecasting system for your needs Auto-selects best model per location |
| Covariate Impact | Transactions cut Chronos error 38-44% vs baseline |
| Time to Deploy | Seconds per store, zero per-store training |
The Platform Value: Easy evaluation of Time-Series Foundation Models and Auto-Selection
Symnasium tested multiple time-series foundation models per store and automatically picked the winner.
What this means: You don't need to force one approach everywhere. The platform runs the horse race and tells you which forecaster won per location. No manual testing required.
Trust here isn’t a promise that the model is right. It’s the receipt that proves which model is right, for which store, with which inputs, and by exactly how much.
The math — what Symnasium saves you
Assumptions
- Chain size: 100 stores, averaging $150,000 in weekly sales each → $15M/week, ~$780M/year.
- Current demand-forecast error and its cost: assume forecast misses drive lost sales + waste equal to 8% of revenue today → $62.4M/year of avoidable loss, split roughly half stockout lost-sales, half overstock spoilage/markdown/safety-stock.
- Measured accuracy gain applied: Symnasium's foot-traffic + best-engine forecasting cut weekly error by a range of 14% to 44% in the study. We take a conservative 25% and an optimistic 40% reduction in forecast-error-driven loss.
Arithmetic
| Scenario | Error-loss cut | Annual recovered value |
|---|---|---|
| Conservative (25%) | 0.25 × $62.4M | ≈ $15.6M / year |
| Optimistic (40%) | 0.40 × $62.4M | ≈ $25.0M / year |
Headline: a 100-store chain on these assumptions recovers roughly $15M–$25M a year — split between recaptured stockout sales and lower spoilage, markdowns, and safety stock. Halve every input for a 50-store operation; the ratio holds. Swap in your real store count, weekly sales, and current error rate and the same arithmetic sizes your opportunity.
Get Started
Ready to see what Symnasium can do with your retail data—or any time-series forecasting challenge?
Try Symnasium Free
Import your data and benchmark models before any commitment
Review Reference Builds
See complete methodology for MLB, pharma, retail, and energy
Custom Evaluation
Run a held-out backtest on your own data