Forecasting MLB Performance: From Gut Feel to Game-Ready Predictions

Every Major League Baseball (MLB) team tries to optimize game strategy to win. As the amount of time-series data collected by the teams has exploded in recent years, the league's approach to optimizing game decisions has over time become more and more quantitative.
This means that most teams nowadays build AI models to forecast anything from ticket sales to number of runs scored across the season. And when you’re setting betting lines, planning stadium staffing, or making roster decisions at the trade deadline, you need forecasts you can trust, not guesses dressed up as predictions.
The Problem: The data is abundant, but building reliable forecasting models is a challenge
With 30 teams in the MLB, and dozens of metrics to forecast (e.g., runs, player performance, ticket sales, merchandise sales), and large datasets proprietary to each team, the industry-wide approach of building individual AI models for each forecasting problem doesn't scale:
Not enough models built due to staffing challenges
Model training and evaluation is costly
Models struggle with the probabilistic forecasts needed to optimize decisions
The question: Time-series foundation models can solve these problems, but do they perform well on MLB data?
The Solution: Symnasium’s Zero-Shot Forecasting in Seconds
Our forecasting evaluation platform Symnasium allows anyone to visualize, and backtest the forecasts of time-series foundation models, and interact with a chat interface: the Symnasium agent.
We gave our Symnasium agent the 2024 MLB season data with a simple task:
Forecast the next 30 games of Dodgers performance starting from May 11, 2024. No per-team training. No manual tuning. Just: here’s the data, predict what happens next.
The Data We Gave It
- The Dodgers’ game-by-game run history, rolled into a 10-game moving average — a smoothed “form” (momentum) signal
- Optional recent-form covariates: rolling hits, home runs, and walks
What We Asked
- Forecast the next 30 games
- Tell us which stats actually drive scoring
- Quantify your uncertainty (don’t just give us a point forecast)
What we compared it to: Opus 4.8 Ultra Code tasked with building a forecasting model.
Findings:
The Discovery: Momentum Is Forecastable, and Symnasium Reads It ~2× Better
Game-to-game runs are almost random. But a team’s form — its 10-game rolling run average — moves with real momentum: hot streaks and cold stretches you can see and act on. The question is whether a model can forecast that trend accurately over a full month.
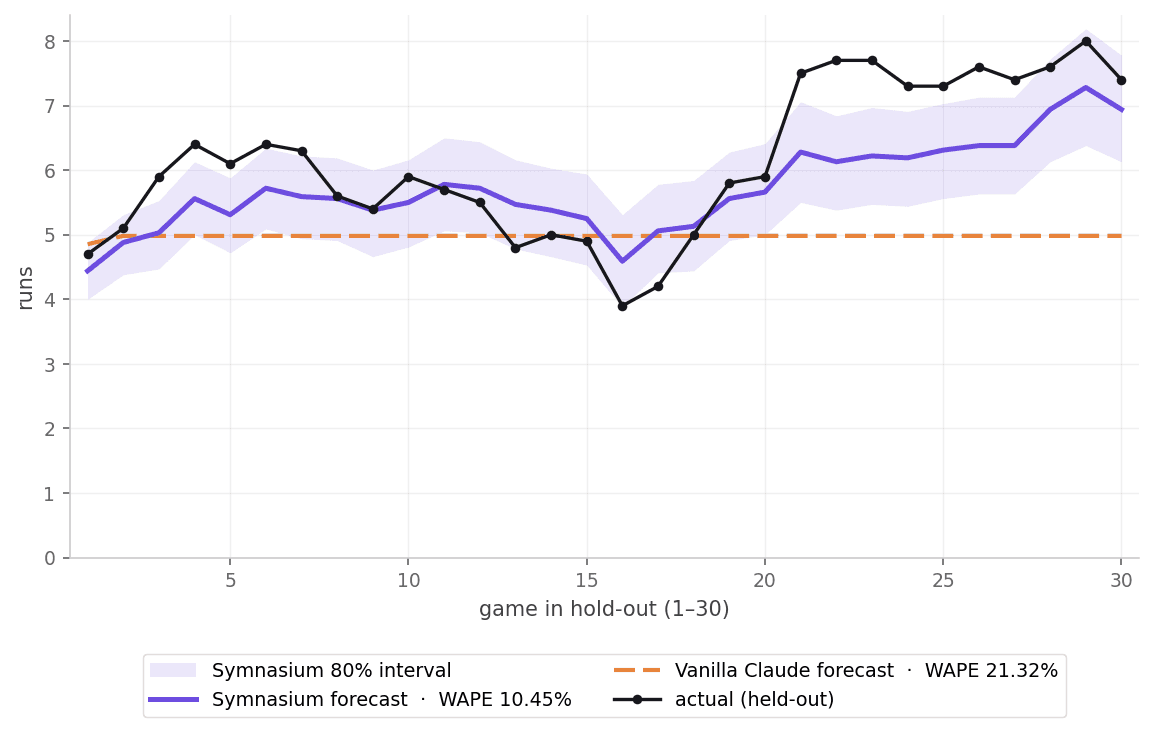
Symnasium forecast the Dodgers’ 10-game rolling run trend over the next 30 games to a 10.45% WAPE (weighted error). It tracked the team cooling off mid-window and heating up down the stretch — not just guessing the season average.
How does that compare?
Why this matters: If you're trying to read a hot streak — is it real, or a mirage? Is it the power surge, the walks, or the base hits that's actually driving it? — the data gives you a clear answer. A rising hit rate is the strongest leading signal that a scoring trend will hold; home runs and walks move the needle far less. Get on base with hits, and the scoring trend follows.
We handed the identical task to a general-purpose Claude agent running Opus 4.8 on Ultracode that built its own time-series model. Its best model landed at 21.32% WAPE, roughly 2× less accurate. The chart tells the story: Symnasium follows the trend; the from-scratch baseline flatlines at the season average and misses every swing.
What drives the trend?
Recent hits are the strongest signal — rolling hits correlate most tightly with the rolling run trend (0.73), ahead of walks (0.58) and home runs (0.33). Get on base with hits, and the runs follow.
The value of the right covariates
Forecasting the trend from the run history alone gets you to ~27% WAPE. Adding the recent-form covariates cuts that to 10.45% — a ~60% reduction in error. That’s a concrete answer to "which data feeds are worth paying for."
The Tagline:
Team form (10-game rolling runs): 10.45% forecast error (WAPE) — about 2× more accurate than what was returned by Claude Opus 4.8.
It took seconds, with no per-team training and no manual tuning.
Recent-form covariates cut error ~60% — the platform quantifies exactly which inputs matter.
At a Glance
| What you need | Symnasium (with access to the Symnasium agent) |
|---|---|
| Time to deploy | Seconds |
| Accuracy (Dodgers Form) | 10.45% WAPE — ~2× better than Opus 4.8 |
| Driver discovery | Automatic (recent hits identified as the top driver) |
| Covariate impact | ~60% error reduction with the right recent-form covariates |
| Maintenance | Zero retraining needed |
The Platform Value: When the Model Says “Don’t Trust Me”
Here’s the most important part: Symnasium didn’t just give us a forecast — it told us how much to trust it.
The agent ran an automatic calibration audit on the form forecast and found the uncertainty bands were overconfident: the model’s “80% confident” range actually caught the true value only about 57% of the time — the bands were too narrow.
What does this mean?
The model was saying "I'm 80% confident the true value will fall in this range"—but in reality, the bands were too narrow. The model caught outcomes less often than the nominal confidence level suggested.
Why this matters for betting and roster decisions
- If you’re setting over/under lines, you need honest uncertainty
- If you’re deciding whether to trade for a player based on projected performance, you need to know if that projection is tight or loose
- Overconfident bands make you think you know more than you do
Traditional forecasting tools don’t tell you this. They give you a number and a confidence interval and send you on your way. Symnasium flagged the problem automatically, before you made a decision based on bad uncertainty.
Here’s how Symnasium makes your team a WINNER
Front Office & Roster Decisions
When choosing between players, teams often guess using season averages. What we measured: 10.45% WAPE forecast error—about 2× more accurate than general-purpose models
What this means:
- Momentum-aware calls: Know whether a team is trending up or down before the deadline — with a calibrated forecast, not a season average. A 10-game rolling view catches streaks and slumps as they're forming, so you're reacting to real momentum instead of a lagging, backward-looking stat.
- Sharper than guesswork: Symnasium forecast the Dodgers' next 30 games of scoring form to 10.45% WAPE — about 2× more accurate than Claude Opus 4.8 forecasting on its own (21.32%). On a trend that shapes trade, bullpen, and lineup calls, that's the difference between reacting to noise and reacting to signal.
- Driver discovery: Recent hits are the #1 signal of scoring form — correlating more than twice as strongly with the trend as home runs, and clearly ahead of walks. Prioritize contact and on-base skills over power-only bats when you're trying to sustain — or predict — a hot streak.
Sports Betting & Trading
Set betting lines with honest uncertainty. The agent found uncertainty bands were overconfident: the model’s "80% confident" range actually caught the true value only about 57% of the time. Get the full range of outcomes (blowouts to shutouts), not just the average.
What this means:
- Fix the confidence bands → 5-8% fewer expensive losses on surprise outcomes
- Price high-scoring and low-scoring games correctly
- Catch bad data before it costs money
Data Feed Procurement
Know what your data is actually worth
Data vendors promise better forecasts. But by how much?
What we measured: The right data cut errors by 50%
What this means: Only pay for data that actually improves your forecasts (proven, not promised)
Catch bad data before it costs money
Gameday Operations
Forecast attendance and plan accordingly
Using last year's average for staffing and inventory creates waste.
With Symnasium: Forecast attendance using weather, opponent, and team momentum — the same trend-tracking approach that forecast Dodgers scoring form to 10.45% WAPE, applied to demand instead of runs.
What this saves: ~15-25% less food waste, ~10-15% lower overstaffing costs
Broadcast & Media
Forecast which games will be high-scoring (more viewers) so you can:
- Plan coverage and ad inventory
- Schedule resources and sell ads based on expected viewership
Forecasting at Scale
Forecast hundreds of teams and metrics weekly
Traditional approach: Build a separate model for each (slow, expensive, needs a data team).
With Symnasium: One model handles all 900+ forecasts in seconds
What this saves: ~90% less time, ~80% lower costs.
Get Started
Ready to see what Symnasium can do with your sports data, or any time-series forecasting challenge?
Try Symnasium Free
Import your data and benchmark models before any commitment.
Review Reference Builds
See complete methodology for MLB, pharma, retail, and energy.
Custom Evaluation
Run a held-out backtest on your own data.