Forecasting the Energy Balance: From the Electricity to the Barrel
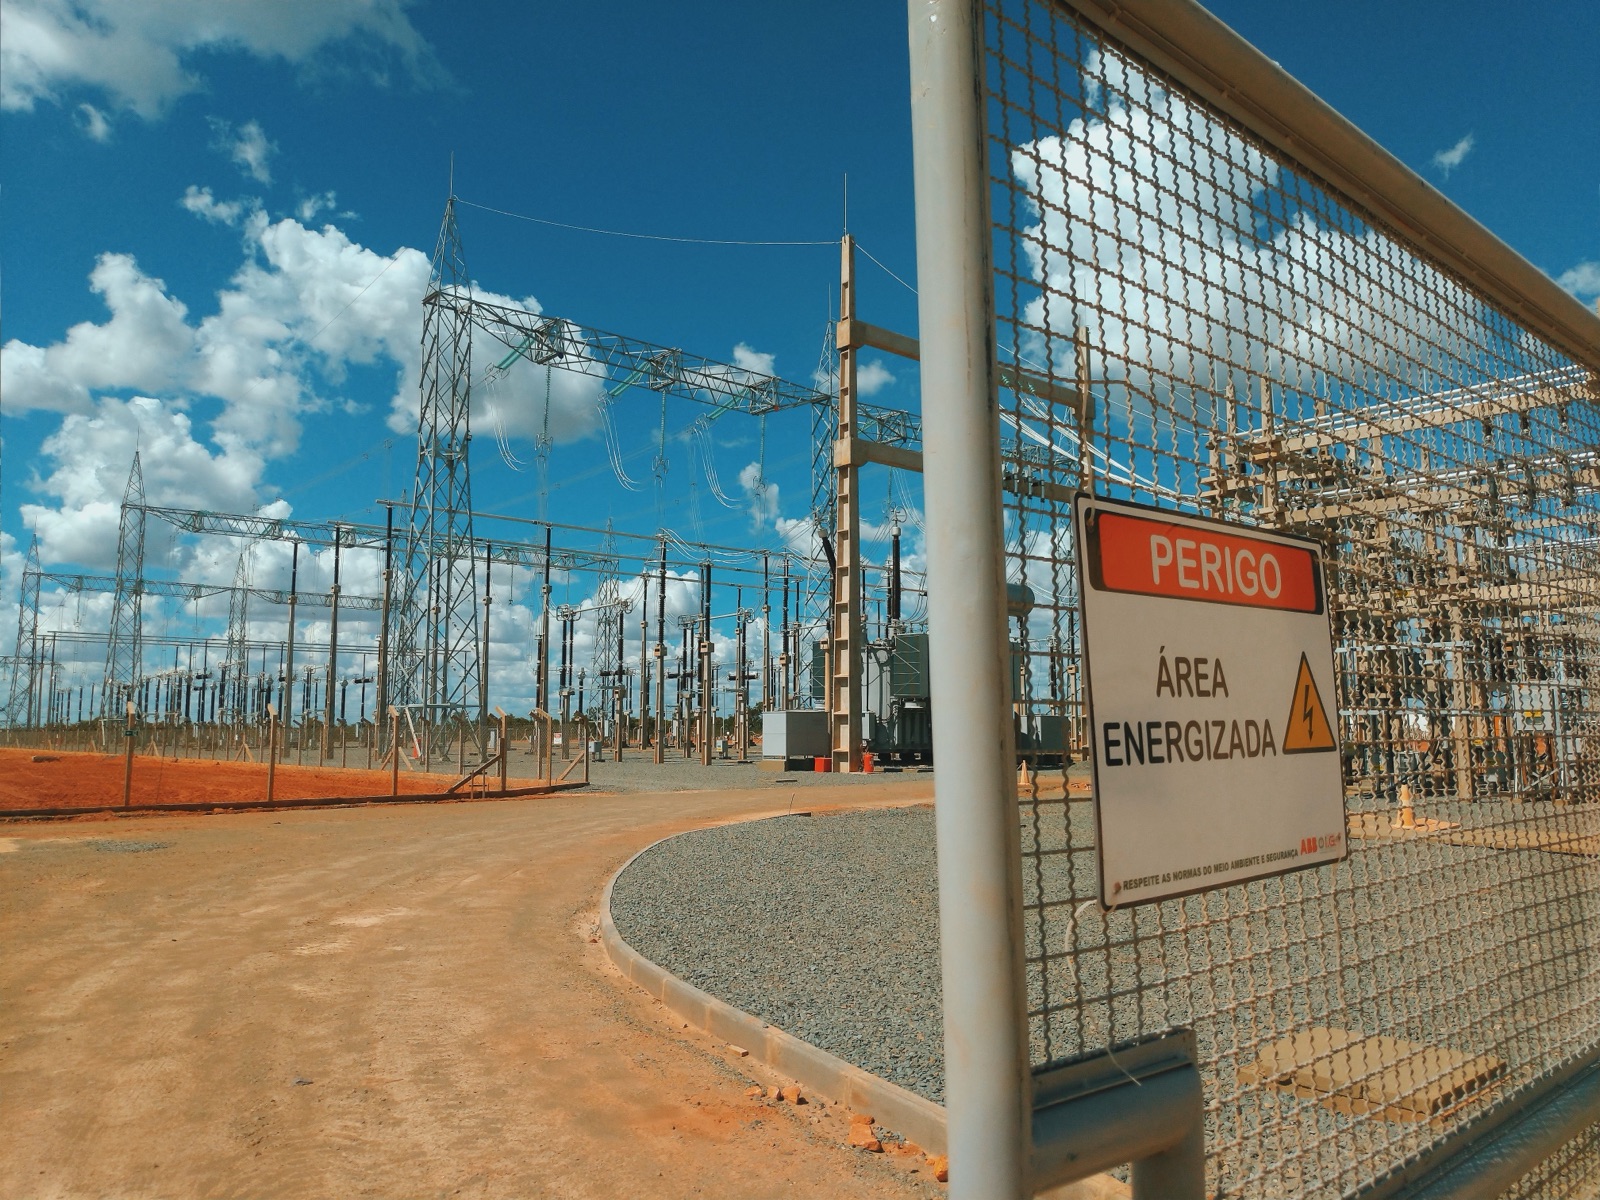
Every hour, someone in the energy sector is committing real money to a number they can't see yet. A trading desk submits a day-ahead bid off tomorrow's price. A dispatcher sets reserves against a real-time spike that hasn't landed. A terminal operator books storage before the tanks fill. A refiner schedules crude intake weeks before the barrels arrive. Each of those decisions is a forecast — and when the forecast is wrong, the cost shows up as a mis-cleared bid, an unhedged scarcity hour, or a demurrage charge.
As energy markets have digitized, the data behind these decisions has exploded: ISO market postings by the hour, weather feeds by the minute, the global crude balance by the month, the futures curve by the tick. The industry's instinct has been to build a bespoke model for every series — one for each pricing node, each grade, each hub. That approach doesn't scale, and it can't cold-start a node or hub with no history. Here, we are going to focus on two specific energy markets: electricity and oil markets.
The Problem: The data is abundant, but reliable forecasting is hard
Energy time series are not one problem — they're many problems wearing the same clothes. While electricity and oil are both data-rich, the forecasting challenges specific to each are distinct:
The Electricity Challenge: Volatility and Leakage
- Price regimes differ by timeframe. Day-ahead power is smooth and self-predictable; real-time power is spiky and regime-shifting, capable of swinging from negative to $600/MWh in hours. A model tuned for one fails on the other.
- The "Look-Ahead" Trap. The most predictive signal for power (load) is rarely known in advance. Using realized load in a backtest creates look-ahead leakage that flatters the model but fails in production.
The Oil Challenge: Supply Cycles and Market Efficiency
- Inventory is a non-linear cliff. Oil forecasting is about identifying inflection points—tank-tops or tank-bottoms. Misidentifying the trend means booking storage you don't need or scrambling for barrels that aren't there.
- The Efficient Market Paradox. In markets like WTI 30 days out, price follows a near-random walk. Naive models often "discover" confident drivers here, but that's usually just overfitting; sizing a hedge off that noise destroys value.
The Universal Constraint: Scale
- Classical models don't scale. Whether you are forecasting power nodes or oil hubs, a hand-tuned SARIMAX/GBM requires a model bake-off and covariate hunt per series. This is unworkable across thousands of nodes and impossible for a new hub with no history.
The question: Time-series foundation models promise to solve all of this at once — but do they actually perform on real energy data, against a capable engineer building a model from scratch?
The Solution: Symnasium's Zero-Shot Forecasting in Seconds
Our forecasting platform Symnasium lets anyone visualize and backtest the forecasts of time-series foundation models, and interact through a chat interface: the Symnasium agent.
We ran the Symnasium agent against two very different corners of the energy world, and — this matters — each dataset was forecast entirely separately. These are two independent studies, not one blended model: the wholesale-power work and the crude-oil work share nothing but the platform. And within each dataset, every target was forecast on its own — we rotated which column was the target one at a time (with the remaining columns available as candidate covariates), so each series got its own clean, independent zero-shot forecast. The task in every case was the same: here's the data, forecast what happens next. No per-series training. No model family to pick. No manual tuning.
The two datasets — forecast independently:
- Wholesale power (NYISO N.Y.C. zone) — Hourly day-ahead and real-time LBMP prices, plus weather covariates (temperature, cloud cover, humidity, wind, irradiance). Each price target was forecast separately over its own 24-hour window.
- The crude-oil balance (JODI + market data) — The monthly US crude balance — closing stocks, refinery intake, production — plus the daily WTI front-month futures price and its market covariates (Brent, natural gas, the WTI–Brent spread). Each balance series and the price were forecast independently, each over its own held-out window.
What We Asked
- Forecast each series over a real held-out window (24 hours for power, 12 months for the crude balance, 30 days for WTI).
- Tell us which signals actually drive each series — and which to ignore.
- Quantify the uncertainty, don't just hand us a point forecast.
What we compared it to
A general-purpose Claude agent running Opus 4.8 Ultra Code, tasked with building its own forecasting model from scratch on the identical data and the identical held-out window. To make the comparison strict, we let the Opus agent tune its model family on a fair inner split, here is what happened.
Findings:
Across the five headline forecasts below, the Symnasium agent won every one — the smooth self-predictable series and the spiky market-driven ones alike — running pure zero-shot in roughly half a second each, with no per-series engineering.
Wholesale Power: Day-Ahead LBMP
Day-Ahead LBMP (Locational Based Marginal Price) is the price of wholesale electricity at a specific location on the grid, determined a day in advance through the Day-Ahead Market.
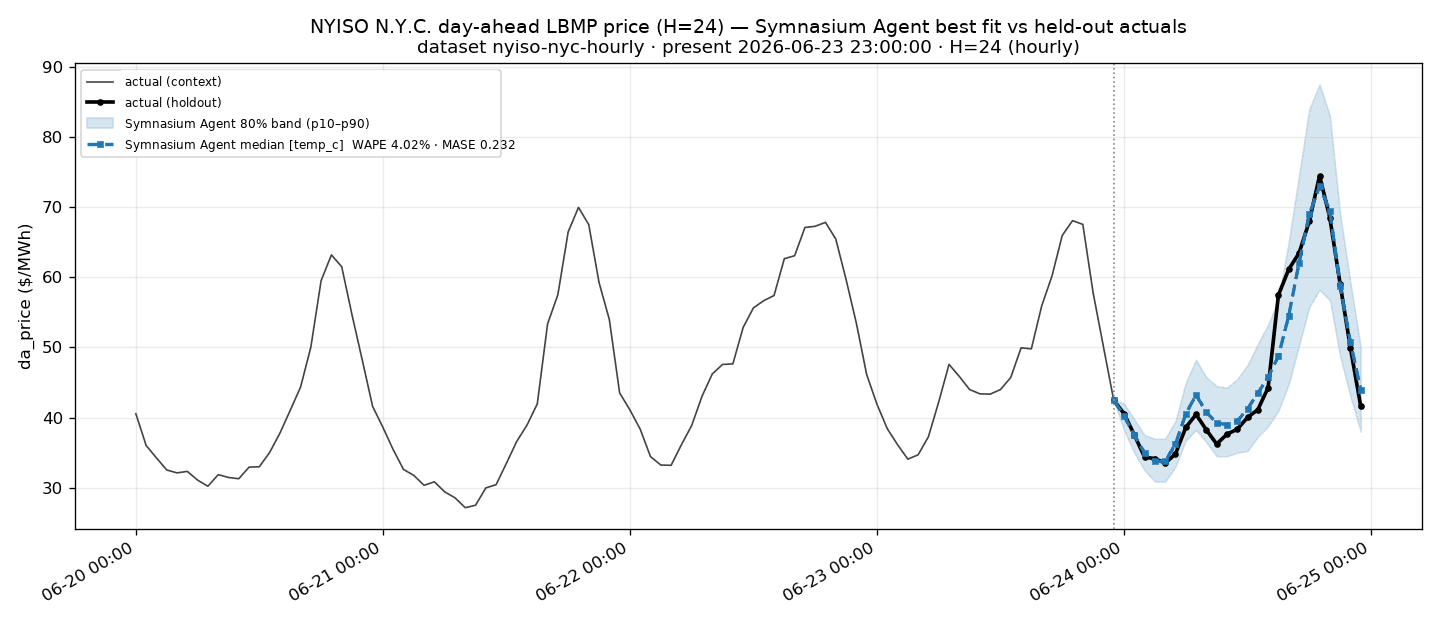
The Symnasium agent forecast the next 24 hours of NYISO N.Y.C. day-ahead LBMP to 4.02% WAPE (MASE 0.232), tracking the overnight trough and the evening ramp up to a ~$73/MWh peak. It did this using a single driver, temperature, which it determined on its own to be the most appropriate covariate to make an accurate forecast.
How does that compare?
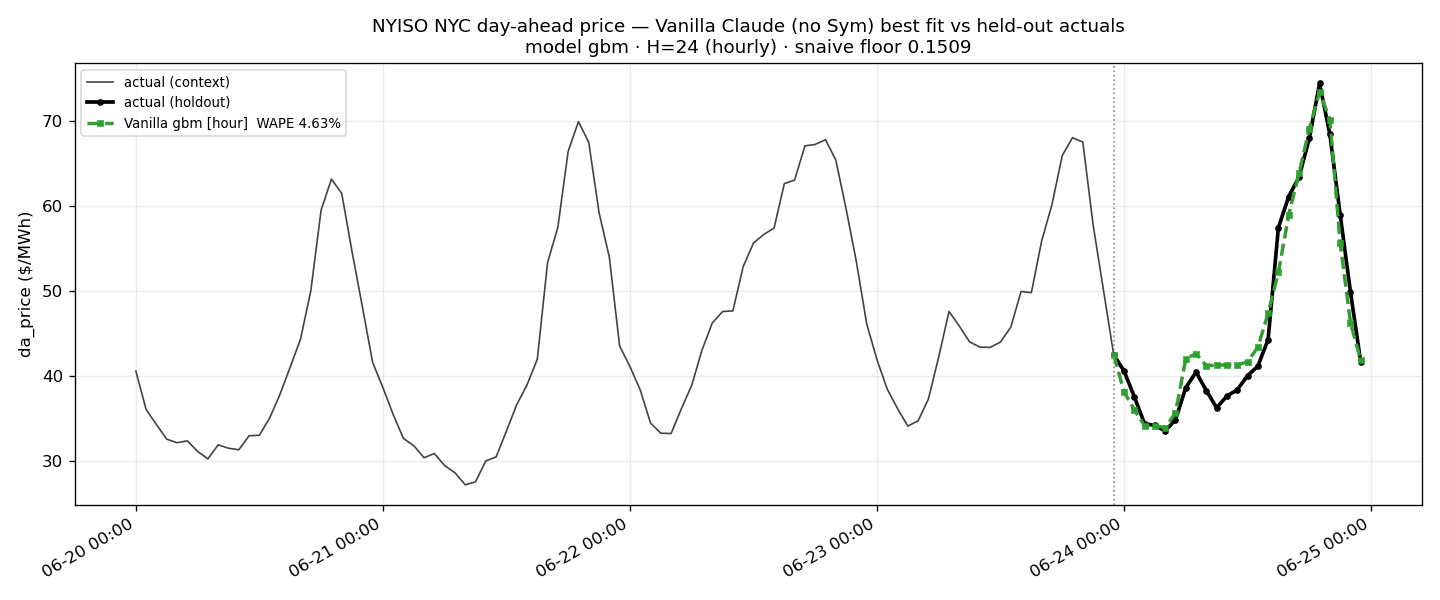
The Opus 4.8 agent's best model landed at 4.63% WAPE. The Symnasium agent still beat it by ~13%. More importantly, the Symnasium agent provided confidence intervals, which Opus 4.8 did not.
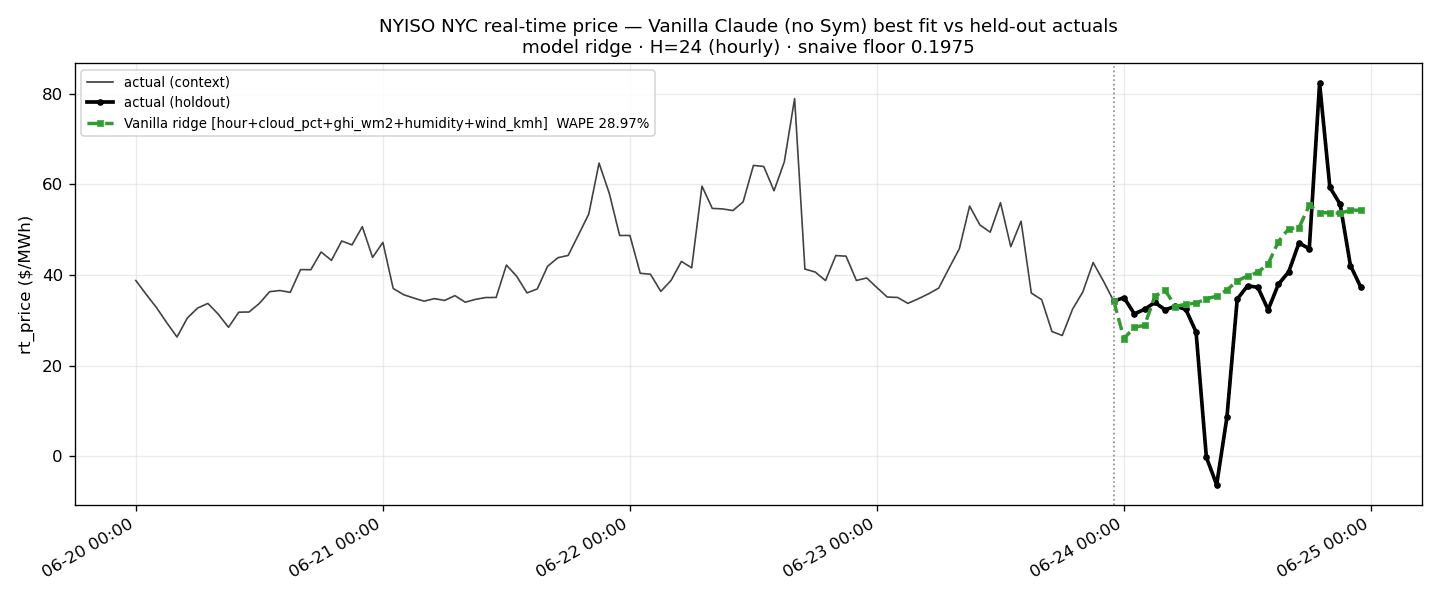
Wholesale Power: Real-Time LBMP
Real-Time LBMP (Locational Based Marginal Price) is the price of wholesale electricity at a specific grid location, calculated during actual operations to reflect conditions as they unfold — as opposed to being set a day in advance.
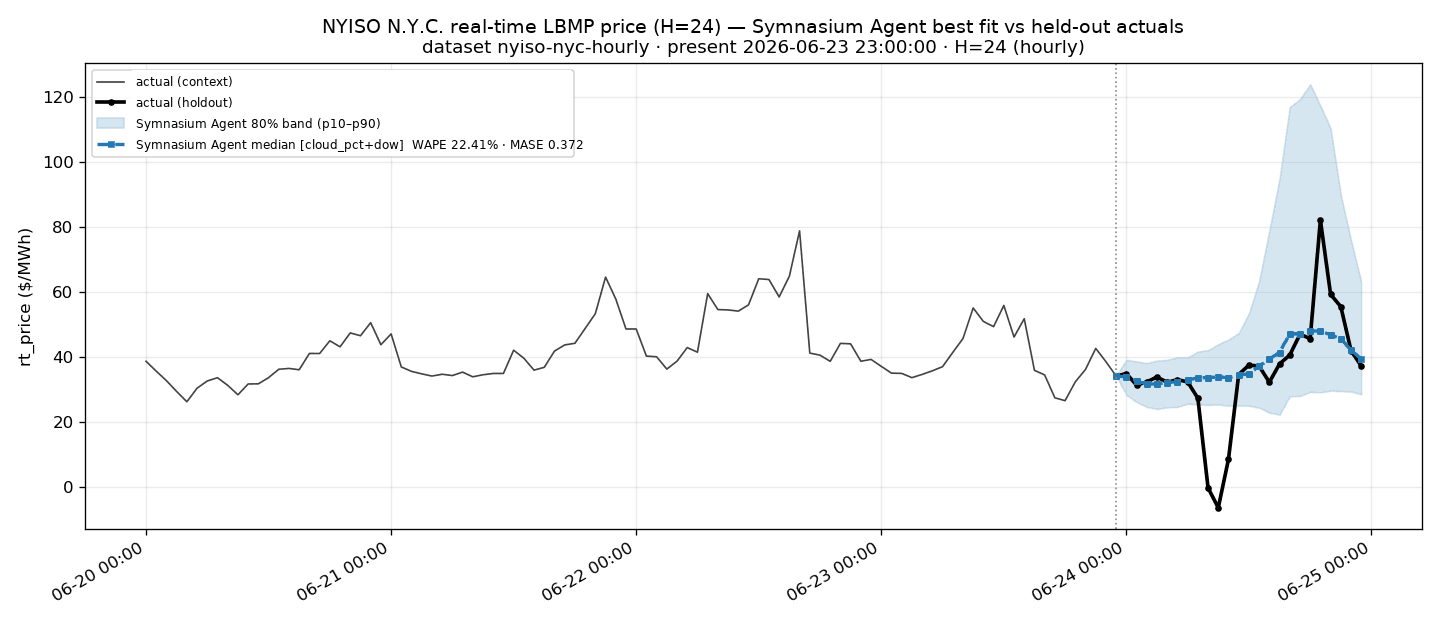
The Symnasium agent forecast it to 22.41% WAPE (MASE 0.372) using cloud cover and temperature data.
How does that compare?
The Opus 4.8 agent reached only 28.97% WAPE. The Symnasium agent was ~23% more accurate, zero-shot.
The Crude Balance: Closing Stocks (Tank-Top Risk)
US crude oil closing stocks is the total volume of crude oil held in storage in the United States at the end of a reporting period. Here, we will look at monthly crude oil stocks.
The Symnasium agent forecast 12 months of US closing crude stocks to 1.37% WAPE (MASE 0.138), with the covariate search naming crude production as the driver. Its 90% confidence interval held 12 of 12 months and contained a genuine late-window stock build (actual 723,565 vs forecast 688,128 kbbl) as a within-uncertainty event, not a false alarm.
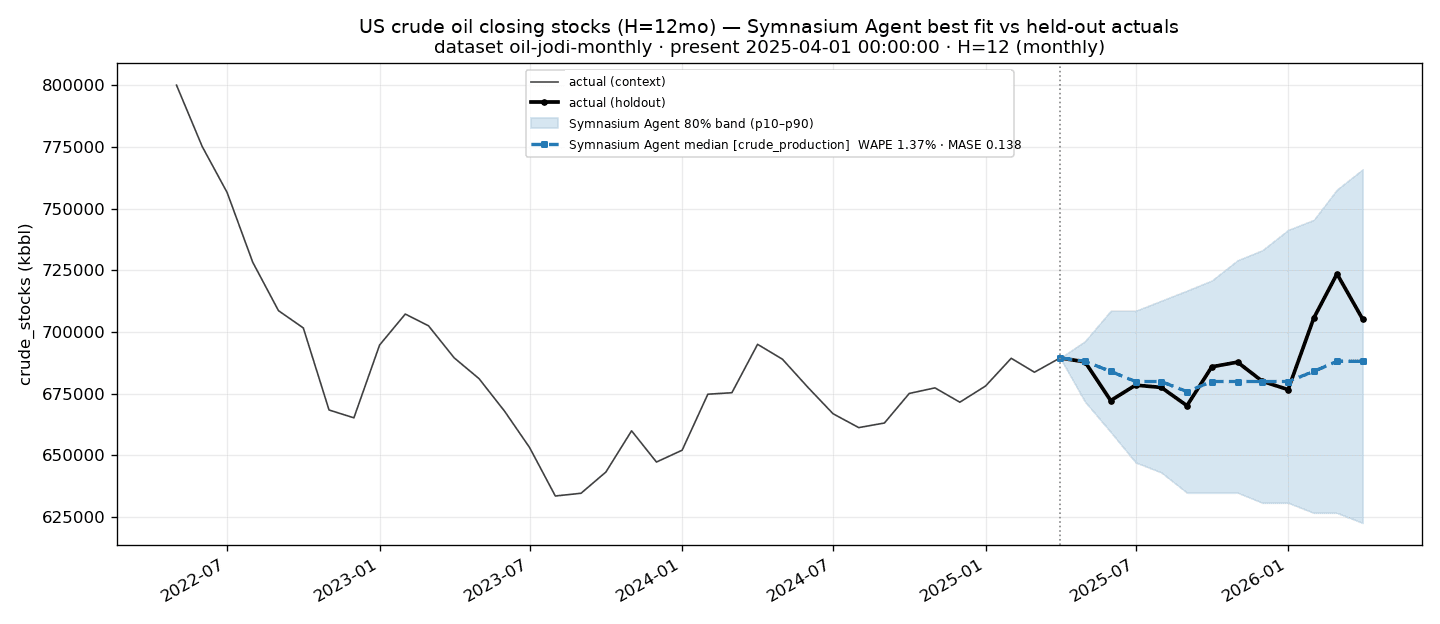
How does that compare?
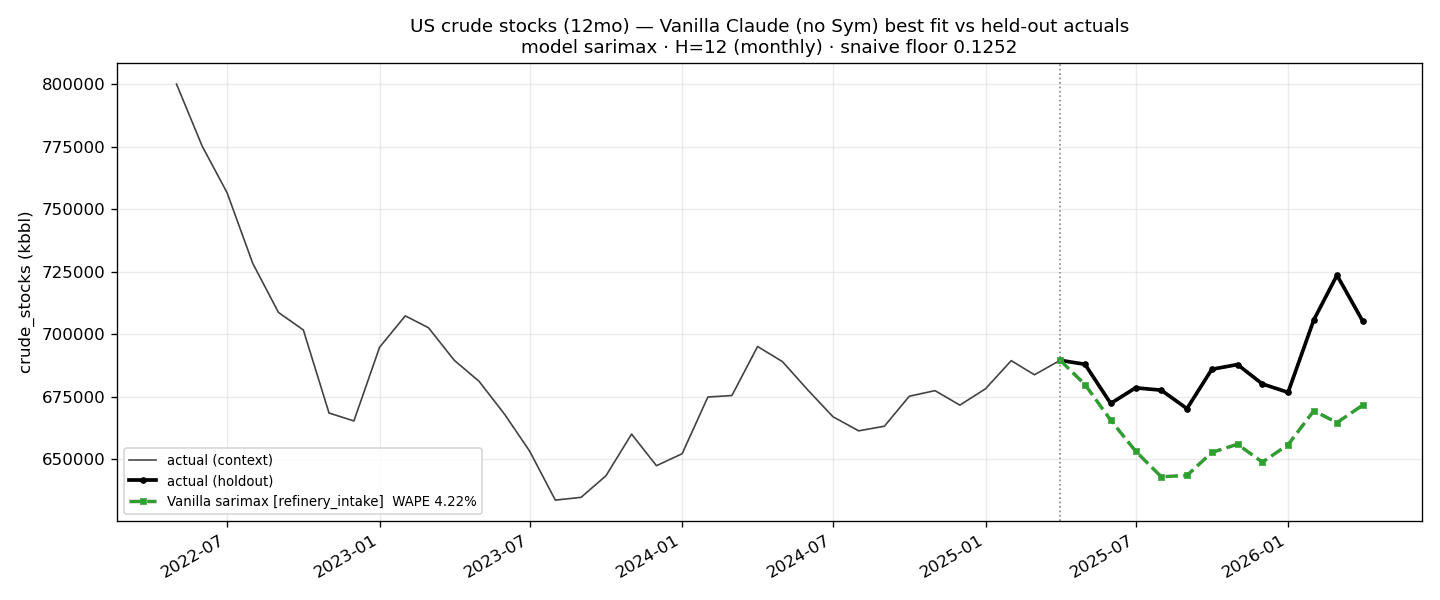
The Opus 4.8 agent landed at 4.22% WAPE — roughly 3× less accurate. The Symnasium agent won the inventory target outright
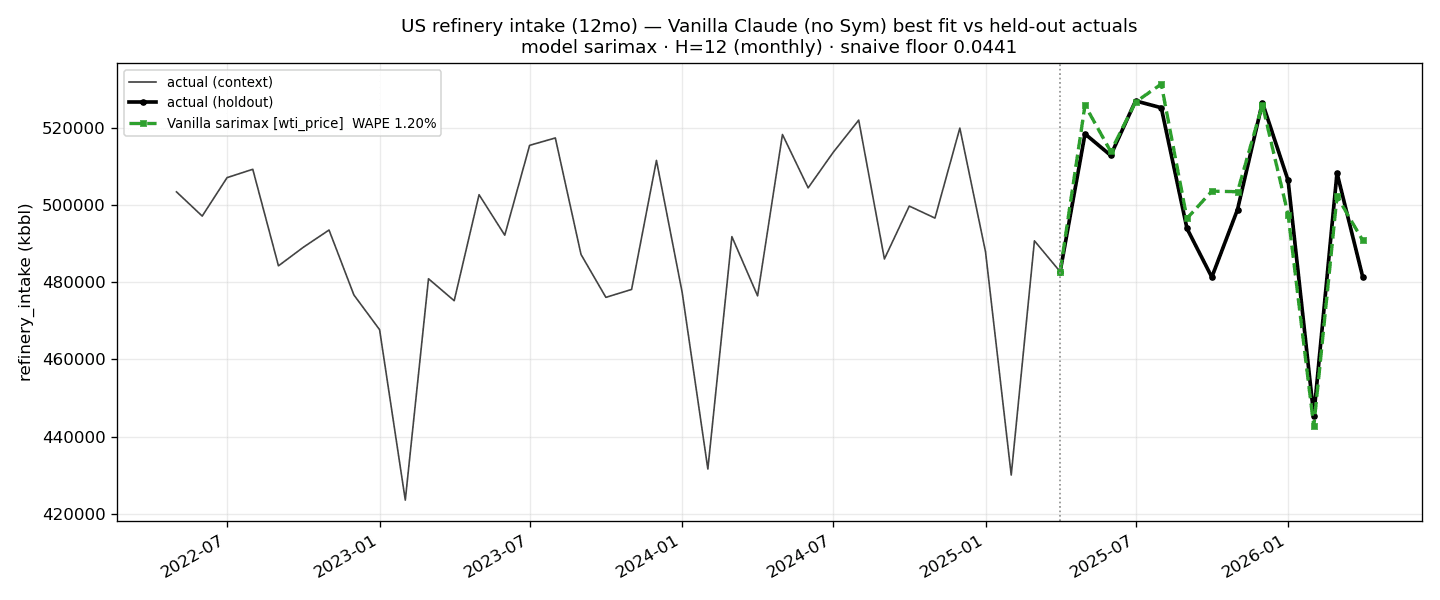
The Crude Balance: Refinery Intake
US refinery crude intake is the volume of crude oil that domestic refineries receive and process into petroleum products like gasoline, diesel, and jet fuel.
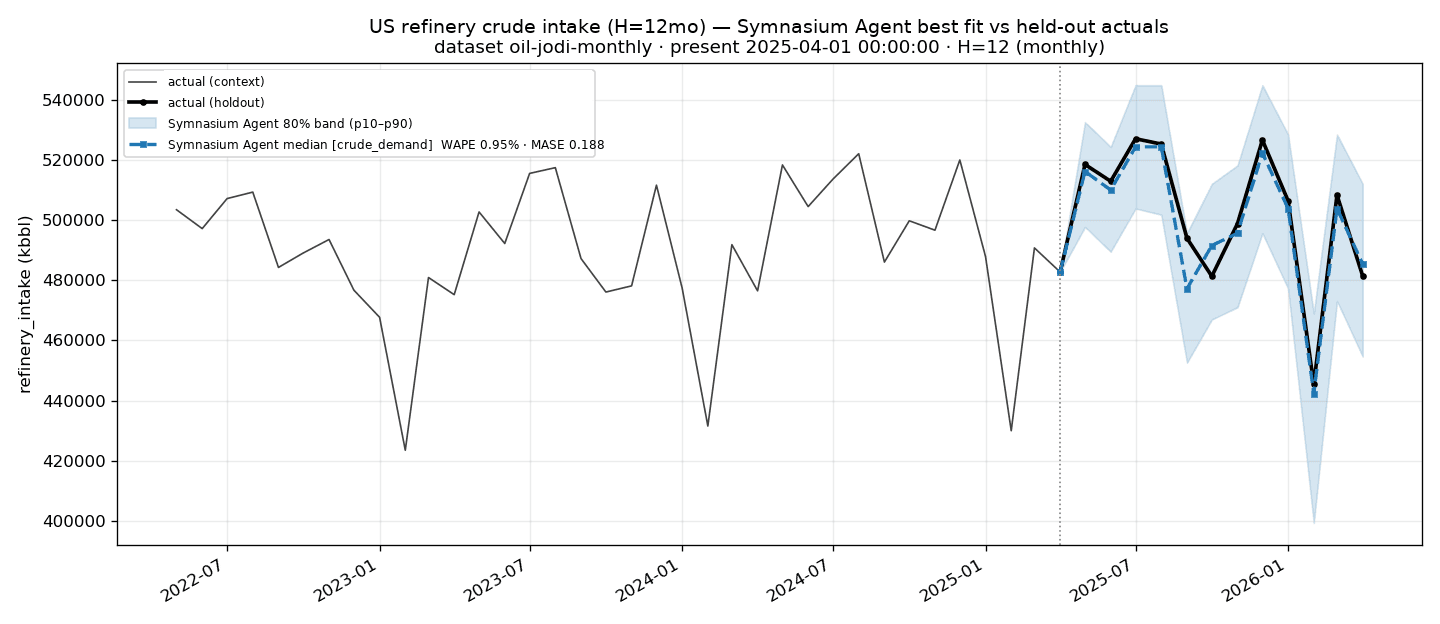
The Symnasium agent forecast refinery intake to 0.95% WAPE (MASE 0.188) — the best-scoring target in the entire study — using crude demand as the driver.
How does that compare?
The Opus 4.8 agent reached 1.20% WAPE. The Symnasium agent was ~21% more accurate — near the noise floor, and indeed provided an 80% confidence interval that covered all realizations.
The Crude Balance: WTI Price — the Efficient-Market Verdict
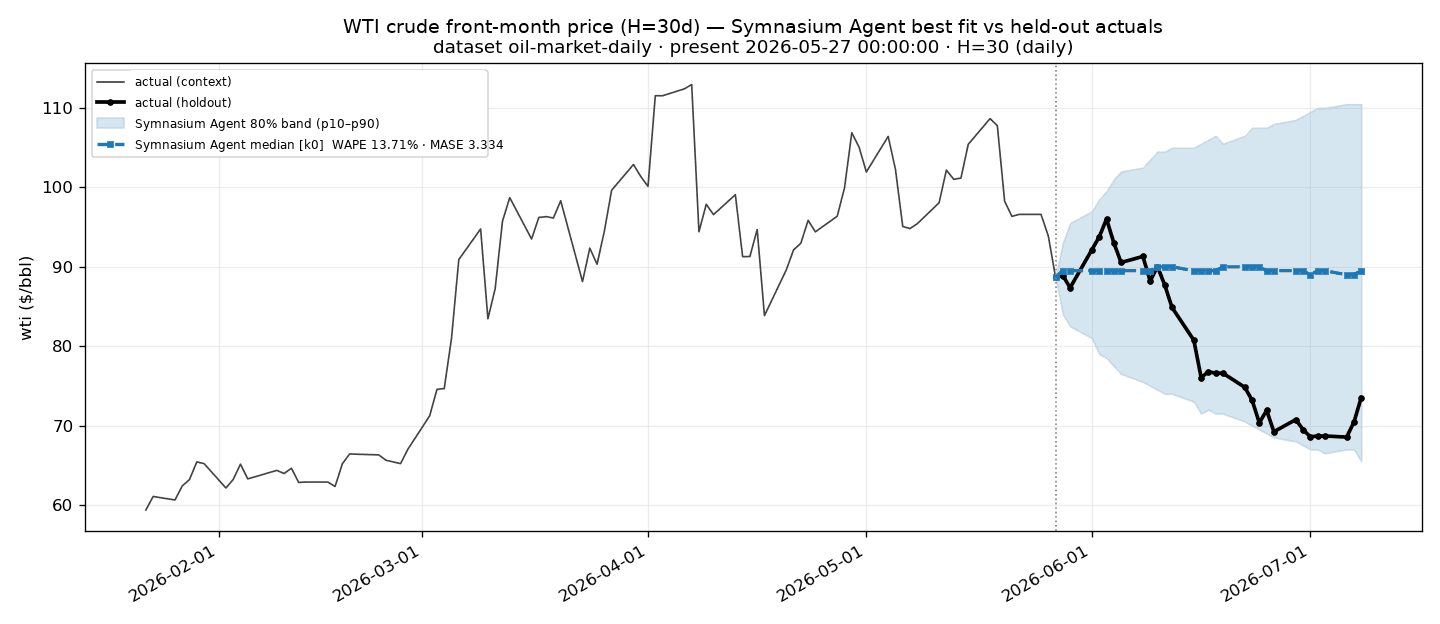
Everyone wants a WTI price forecast, and plenty of tools will happily "find" a driver for one. But WTI 30 days out is an efficient, near-random-walk market — a model that discovers a confident price signal is usually just overfitting, and sizing a hedge off it means trading noise.
The Symnasium agent forecast WTI to 13.71% WAPE based on WTI history. The 90% band held 30 of 30 days through a real 23% price drop — correctly wide, not falsely precise.
How does that compare?
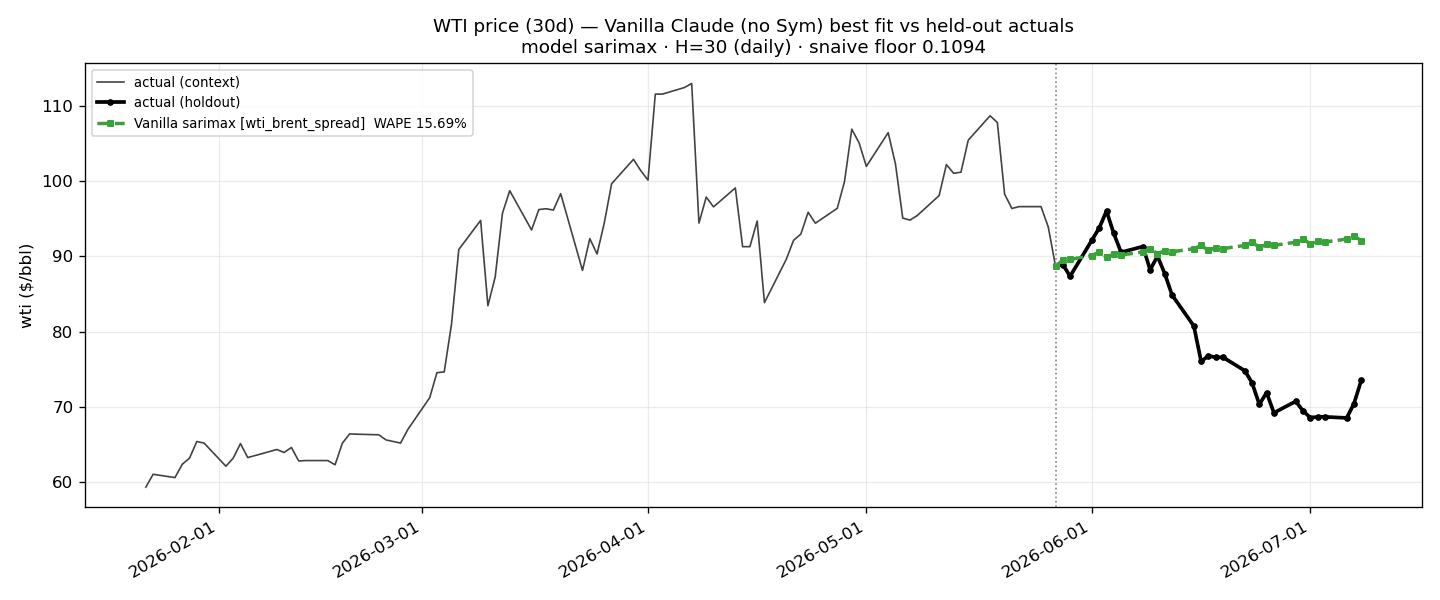
The Opus 4.8 agent — which did reach for WTI Brent spread as a covariate — landed at 15.69% WAPE. The Symnasium agent was ~13% more accurate and declined the very covariate Opus 4.8 leaned on, which is often hard to predict.
The Tagline: One platform, five energy forecasts, five wins — smooth and spiky alike.
The Symnasium agent beat a general-purpose Opus 4.8 agent on every target below, running pure zero-shot in ~0.5–0.6 seconds each, with no per-series model-building and no manual tuning — even though the Opus agent was allowed to peek at the answers and use perfect future covariates.
It took seconds, with zero per-series training and no manual tuning.
| Target | Symnasium agent | Opus MAE | Improvement |
|---|---|---|---|
| NYISO day-ahead LBMP (H=24h) | 4.02% WAPE | 4.63% | ~13% better |
| NYISO real-time LBMP (H=24h) | 22.41% WAPE | 28.97% | ~23% better |
| US crude closing stocks (H=12mo) | 1.37% WAPE | 4.22% | ~300% better |
| US refinery intake (H=12mo) | 0.95% WAPE | 1.20% | ~21% better |
| WTI front-month price (H=30d) | 13.71% WAPE | 15.69% | ~13% better |
Summary
| What You Need | Symnasium (with the Symnasium agent) |
|---|---|
| Time to deploy | Seconds |
| Accuracy (power prices) | 4.02% / 22.41% WAPE — beats Opus 4.8 on both |
| Accuracy (crude balance) | 0.95%–1.37% WAPE — up to ~3× better than Opus 4.8 |
| Price honesty (WTI) | Correctly declined all covariates — no overfit |
| Driver discovery | Automatic, per-series, with leakage checks |
| Uncertainty | Calibrated probability bands by default |
| Maintenance | Zero retraining; one model across all series |
The Platform Value: When the Model Tells You What NOT to Trust
The most important part isn't the accuracy number — it's that Symnasium tells you how much to believe it before you commit money to it. Across this study the Symnasium agent not only was more accurate but provided confidence intervals a point forecast never could:
It flagged the tail it couldn't cover. The Symnasium agent's probabilistic approach to forecasting protects a trading desk from betting on noise. Indeed, its bands stayed calibrated where it could forecast: 12/12 on crude stocks, 30/30 on WTI through a 23% drop.
How Symnasium Makes Your Energy Desk a Winner
Every figure below is a back-of-the-envelope estimate built on stated, deliberately conservative assumptions. They're meant to show the shape and order of magnitude of the value — swap in your own volumes and prices to size it to your book.
Day-Ahead Bid Pricing — Trading Desks & Load-Serving Entities
Price tomorrow's day-ahead bids off the real, weather-driven curve instead of last week's shape.
What we measured: 4.02% WAPE on NYISO day-ahead LBMP — ~13% more accurate than an Opus 4.8 build, with a sharp band covering 23/24 hours.
Illustrative dollar math:
- Real-time LBMP can jump from ~$50 to $600/MWh.
- A desk caught short 100 MW during one unhedged spike hour: 100 MWh × ($600 − $50) = ~$55K of exposure in a single hour.
- NYC sees on the order of 20–40 material spike hours/year. If earlier, sharper spike forecasts let you pre-position reserves, DR, or battery for even ~15 of them: 15 × $55K ≈ ~$825K/year of avoided scarcity cost. A battery operator flips the identical math into captured upside by dispatching into the spike.
What this means: Pre-position reserves, demand response, and battery dispatch against a forecast spike rather than reacting after settlement — and the band flags the negative-price and scarcity hours a naive point forecast hides.
Storage & Tank-Top Risk — Terminals & Midstream
Know the build is coming before Cushing tops out.
What we measured: 1.37% WAPE on US closing crude stocks — ~3× more accurate than Opus 4.8, with a 90% band that contained a real late-window build.
Illustrative dollar math:
- Seeing a build early lets you book storage before it's bid up and avoid forced, last-minute cover.
- Forced floating storage runs ~$25–40K/day per VLCC. Avoiding two scramble events of ~5 days each: 2 × 5 × $30K ≈ $300K.
- Pre-booking tank capacity ahead of a build at, say, $0.40/bbl·mo instead of a squeezed $0.80 on 2 MMbbl ≈ $800K per build avoided.
- For a large terminal, order of ~$1M+/year in avoided demurrage and better-timed storage bookings.
What this means: Project tank-fill and tank-bottom risk from the actual driver (production) → better-timed storage bookings and fewer forced demurrage / floating-storage charters.
Refinery-Run Planning — Refiners & Supply Optimizers
Plan crude intake against the demand that actually drives it.
What we measured: 0.95% WAPE on refinery intake — the best forecast in the study, ~21% better than Opus 4.8.
Illustrative dollar math:
- A 200,000 bbl/day refinery → ~73 MMbbl/year, ~$5B of crude at $70/bbl.
- Timing feedstock purchases and turnarounds well enough to shave even $0.05–0.10/bbl of avoidable spot premium and demand mismatch: 73M × $0.05–0.10 ≈ $3.6–7.3M/year.
What this means: Time feedstock purchasing and turnarounds on the real demand lever, with reliable confidence intervals.
WTI Hedging — Commodity Risk & Treasury
Hedge against an honest band, not a phantom point signal.
What we measured: 13.71% WAPE.
Illustrative dollar math:
- The value here is not over-trading a phantom signal. Say treasury hedges ~5 MMbbl/year.
- One conviction overlay sized off an overfit "signal" that moves 5% the wrong way on 1 MMbbl: 1M × $70 × 5% = $3.5M swing avoided.
- Even a single avoided misfire per year dwarfs the platform cost; the calibrated band sizes coverage to real risk instead of a fabricated Brent-implied forecast.
What this means: Size options coverage against a calibrated confidence interval instead of a meaningless point signal → fewer conviction trades on unforecastable moves.
Forecasting at Scale & Cold-Start
Forecast thousands of nodes, grades, and hubs — including brand-new ones.
Traditional approach: a separate model per series — a bake-off, and covariate hunt each time (one from-scratch fit of Opus 4.8 in this study ballooned to 28 seconds), and nothing at all for a newly-energized node or hub.
With Symnasium: one pretrained model, seconds to a forecast, zero per-series training, and cold-start via in-context cross-learning — a new node borrows the diurnal price shape from donor nodes in the same load pocket.
What we measured: 13.71% WAPE.
Illustrative dollar math: A forecasting quant's salary ≈ $300–400K/year. Standing up and maintaining per-series models across thousands of nodes is easily 1+ FTE-years of effort; collapsing it to one pretrained model saves ~$300K+/year in engineering (~90% less modeling time), plus a usable day-one forecast for series classical models structurally cannot serve.
Get Started
Ready to see what Symnasium can do with your energy data — or any time-series forecasting challenge?
Try Symnasium Free
Import your ISO postings, weather feeds, or crude balance and benchmark models before any commitment.
Review Reference Builds
See the complete methodology for energy, pharma, retail, and MLB.
Custom Evaluation
Run a held-out backtest on your own data.
Symnasium turns your market postings, weather feeds, and the global crude balance into calibrated, spike-aware forecasts in seconds — and tells you exactly how far to trust each one before it hits a bid, a hedge, or a storage booking.